Hehe, see what I did there? This is a fairly long and boring analysis on ALL Engineering specialisations (with MATHS!), so be warned.
It’s no secret there’s a lot of competition in engineering. While I don’t have any historical data (or any data at all) on the GPA requirement for each specialisation (these aren’t made public as the requirements can vary significantly from year to year), I can predict what the more competitive specialisations are likely to be this year. A specialisation is ‘competitive’ if there are more people who list that as their first choice, compared to the number of seats available in that specialisation. When this happens candidates are ranked according to their Part I GPA. If they don’t make the cut, the same process occurs for their 2nd choice and so on, until they get into something. A GPA of 6.5 (B+/A- average) is usually sufficient to get into your first choice, but I know for a fact that it can and has gone higher… so yeah.
These calculations are based on the number of places available next year and polling data gathered from the First Year Engineering Facebook page. Having taken the polling data, which should be a reasonable sample of the population (with some caveats; the survey is self-selected, and some participants may be outside the target demographic dear god I am boring you aren’t I). I have extrapolated this data to find the number of people in the cohort who would choose each specialisation as their first choice. So without further ado:
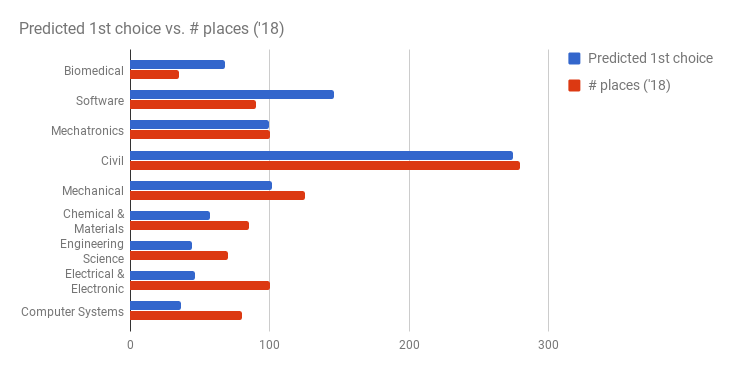
As you can see there is quite a bit of disparity between everyone’s predicted first nominated choice and the actual number of seats available in each specialisation. Notably, Biomedical and Software Engineering are the most competitive and Electrical & Electronic and Computer Systems Engineering are the least competitive (according to the graph, that is). Both Civil and Mechatronics Engineering appear to have the best Predicted vs. Allocated ratio, that is the number of spaces is more or less equal to the number of first choices. Interestingly, according to the poll Engineering Science isn’t too popular – however historically it was also up there as one of the most competitive specialisations. Just shows how quickly things can change.
Another interesting statistic to think about is how have the allocations changed over time? To figure this out, I used the Wayback Machine to get the numbers:
| Specialisation | 2015 | 2016 | 2017 | 2018 |
| Biomedical | 28 | 28 | 30 | 35 |
| Software | 75 | 80 | 90 | 90 |
| Mechatronics | 80 | 80 | 80 | 100 |
| Civil | 220 | 230 | 240 | 280 |
| Mechanical | 120 | 130 | 130 | 125 |
| Chemical & Materials | 75 | 75 | 80 | 85 |
| Engineering Science | 45 | 45 | 48 | 70 |
| Electrical & Electronic | 110 | 110 | 110 | 100 |
| Computer Systems | 60 | 65 | 65 | 80 |
Overall, the number of allocations have varied slightly over the years, however there does appear to be some interesting talking points in the above table. For one, the big increase in seats for Engineering Science in 2018, a 45% increase compared to this year. The same happened with Computer Systems. Software Engineering hasn’t changed at all from last year, despite the high demand. This is understandable if there simply aren’t enough resources to accommodate the demand, however it does leave quite a few people very disappointed.
So that’s my analysis, but do take it with a grain of salt. As they say, don’t always trust the polls. I also haven’t done anything statistics-related in months.